Results or Data of the Questionnaire Collected
After collect all the questionnaire from the customers, I had using the SPSS Software to analyse the data. The following section shows the analysis of the result I get.The followings are the result of graph and table for each of the question in the questionnaire.
Staff's Services
2(A) Does the staff attentive and available when you needed him or her?

Graph1.1 Staff's Attentive and Availability
The graph in the above shows that 15 out of 20 respondents choose the neutral option about the staff's attentive and availability when they needed him or her. Besides that, the graph and table in the above also shows that out of the rest 5 respondents, there are 2 of them agree with the condition of the staff was attentive and available when they needed him or her and the rest of 3 respondents strongly agree with the condition of the staff was attentive and available when they needed him or her. The reason of 15 out of 20 respondent provided for the neutral side is sometimes the staff was not able to serve them when they are calling the order. They said it might due to the reason of the peak hours, the staff is not able to do so.
2(B)Does the staff knowledgeable and able to answer your questions about the menu items?

2(C)Does the staff friendly and patient when taking your order?


 Graph 1.5 Staff's Level of Taking Care of Order
 Graph 1.8 Foods Serving Speed
Graph 1.9 Food's Taste, Cleanliness and Flavour
Graph 1.10 Selection of Menu Items
 Graph 1.11 Restaurant's Cleanliness
 Graph 1.12 Tables and Chairs' Cleanliness
 Graph 1.13 Restaurant's Ventilation
 Graph 1.14 Restaurant's Lighting

Graph 1.2 Staff's Knowledge about Menu Items (Knowledgeable and Able to Answering Questions)
The graph in the above shows that 1 out of 20 respondents strongly disagree with the staff knowledge about the menu items. Besides that, there are 6 out of the rest 19 respondents choose the neutral options and 12 out of the rest 13 respondents agree with the condition of the staff was knowledgeable about the menu items and able to answers the question asked by customers.Lastly, there are rest of respondents strongly agree with the condition of the staff was knowledgeable about menu items and able to answer the questions asked by them. The reason for 1 out of 20 respondents strongly disagree with the condition of staff was knowledgeable about the menu items and able to answer the question asked is the staff was not sure about what ingredient is include in the foods. For the 6 out of the rest 19 respondents choose the neutral option is because they are facing the same issue with the one who choose strongly disagree option but sometimes the staff can serve very well.
2(C)Does the staff friendly and patient when taking your order?
Graph 1.3 Staff Attitude (Friendly and Patient)
2(D) Does the staff dress appropriately, neat and cleans in appearance?
The graph in the above shows that 1 out of 20 respondents strongly disagree with the staff's attitude. Besides that, 9 out of the rest 19 respondent choose the neutral option about the staff's attitude and another 9 out of the rest 10 respondents agree with the condition of the staff was friendly and patient when taking their order. There are rest of 1 respondents strongly agree with the condition of the staff was friendly and patient when taking their order. The reason for the 1 out of 20 respondents strongly disagree with the staff's attitude is the staff make the customer feel like the staff don't likely to serve them and act like want to finish the work early. The reason for the 9 out of the rest 19 respondents choose the neutral option is because they feel nothing or they are not able to measure the standard of the staff's attitude.
Graph 1.4 Staff's Appearance (Dress Appropriately, Neat and Cleans)
The graph in the above shows that 1 out of 20 respondents strongly disagree about the staff's appearance and 7 out of the rest 19 respondents choose the neutral option about the staff's appearance. Besides that, there are 8 out of the rest 12 respondents agree with the condition of the staff was wearing appropriately, neat and cleans. There are rest of 4 respondents strongly agree with the condition of the staff was wearing appropriately, neat and cleans. The reason for 1 out of 20 respondents strongly disagree about the staff's appearance is the shirt did not fill in the pants properly. The reason choose neutral option is because majority of them feel nothing about the staff appearance.
2(E) Does the staff has always making sure about the order was served?
The graph in the above shows that each 2 out of 20 respondents strongly agree and disagree about the condition of the staff was always taking care their order. Besides that, there are 6 out of the rest 18 respondents choose neutral side option about the condition of staff's level of taking care the order. There are 9 out of the rest 12 respondents agree with the condition of the staff was always making sure their order was served and the rest of 1 respondents strongly agree with the condition of the staff was always making sure their order was served.The reason for each 2 out of 20 respondents strongly disagree and disagree is because they have not received any action about this services. For the reason of 6 out of the rest 18 respondents choose neutral side is because the food was served correctly and there is not necessary for the staff always come and ask for ensuring the order was out.
Products
3(A)Does the foods served correctly as order?

Graph 1.6 Food Served Correctly As Order
The graph in the above shows that 1 out of 20 respondents disagree with the condition of the foods were served correctly as order.There are 11 out of the rest 19 respondents choose neutral option. Besides that, 5 out of the rest 8 respondents agree with the condition of the foods were served correctly as order and the rest 3 respondents strongly agree with the condition of the foods were served correctly.
3(B)Does the food served hot and fresh?

Graph 1.7 Foods Served Hot and Fresh
The graph in the above shows that 2 out of 20 respondents disagree with the condition of the foods were served hot and fresh. There are 5 out of the rest 18 respondents choose neutral option. Besides that, 10 out of the rest 13 respondents agree with the condition of the foods were served hot and fresh and the rest 3 respondents strongly agree with the condition of the foods were served hot and fresh. The reason for 5 out of the rest 18 respondents choose neutral option is because of they feel confused about what is the measurement of hot and fresh. It might because the foods have Sushi which is cold to be served or the main course which is hot to be served. They feel confused about it.
3(C)Does the food served very fast? (Minimum 15 minutes)
The graph in the above shows that 2 out of 20 respondents strongly disagree with the condition of the foods were served fast. There are 9 out of the rest 18 respondents choose neutral option. Besides that, 7 out of the rest 9 respondents agree with the condition of the foods were served fast and the rest of 2 respondents strongly agree with the condition of the foods were served fast. The reason for 9 out of the rest 18 respondents choose neutral option is because there are some food served very fast but there are are some food served very slow, they found difficult to decide.
3(D) Are the foods very tasty, clean and flavourful?

The graph in the above shows that 1 out of 20 respondents disagree with the condition of foods were tasty, cleans and flavourful. There are 7 out of 19 respondents choose neutral option. Besides that, 8 out of 12 respondents agree with the condition of the foods were tasty, cleans and flavourful and the rest of respondents strongly agree with the condition of the foods were tasty, cleans and flavourful. The reason for 7 out of 19 respondents choose neutral option is because some food very delicious but some food might not be very tasty.
3(E) Does the menu had an excellent selection of items?

The graph in the above shows that 2 out of 20 respondents disagree with the condition of the menu items have sufficient selection. There are 6 out of 18 respondents choose the neutral option. Besides that, 10 out of 12 respondents agree with the condition of the menu items have sufficient selection and the rest of 2 respondents strongly agree with the condition of the menu items have sufficient selection. The reason for 6 out of 18 respondents choose the neutral option is because the Rakuzen having change their promotion menu every seasons, when they want to choose the previous seasonal foods, the kitchen cannot managed to do it. It make them feel disappointing.
Environment
4(A)Is the restaurant very clean?
The graph in the above shows that 1 out of 20 respondents disagree with the condition of the restaurant was cleans. There are 11 out of the rest 19 respondents choose the neutral option. Besides that, 5 out of the rest 8 respondents agree with the condition of the restaurant was cleans and the rest of 3 respondents strongly agree with the condition of the restaurant was cleans. The reason of 11 out of 19 respondents choose neutral option is because of there are some area very clean but some area is not clean, they cannot managed to decide which option should be tick or choose.
4(B)Are the tables and chairs very clean?
The graph in the above shows that 1 out of 20 respondents disagree with the condition of tables and chairs' were clean. There are 7 out of the rest 19 respondents choose the neutral option. Besides that, 10 out of the rest 12 respondents agree with the condition of tables and chairs' were clean and the rest of 2 respondents strongly agree with the condition of tables and chairs' were clean.
4(C)Is the restaurant’s ventilation excellent?
The graph in the above shows that 1 out of 20 respondents disagree with the condition of the restaurant's ventilation was good. There are 12 out of the rest 19 respondents choose the neutral option. Besides that, 2 out of the rest 7 respondents agree with the condition of the restaurant's ventilation was good and the rest of 5 respondents strongly agree with the condition of the restaurant's ventilation was good.
4(D) Is there excellent lighting?
The graph in the above shows that 1 out of 20 respondents disagree with the condition of the restaurant's lighting was good. There are 10 out of the rest 19 respondents choose neutral option. Besides that, 5 out of the rest 9 respondents agree with the condition of the restaurant's lighting was good and the rest of 4 respondent strongly agree with the condition of the restaurant's lighting was good. The reason of 10 out of 19 respondents choose neutral option is because of there are some area very bright but some area is dark, they cannot managed to decide which option should be tick or choose.
4(E). Does the environment comfortable and leniency?
Graph 1.15 Restaurant's Environment (Comfortable and Leniency)
The graph in the above shows that 4 out of 20 respondents choose the neutral option with the condition of the restaurant's environment was comfortable and leniency. There are 10 out of the rest 16 respondents agree with the condition of the restaurant's environment was comfortable and leniency and the rest of 6 respondents strongly agree with the condition of the restaurant's environment was comfortable and leniency.


Overall Satisfaction
5(A) Does the services excellent?
Graph 1.16 Excellent Services
The graph in the above shows that 9 out of 20 respondents choose the neutral option about the overall services provided by Rakuzen were excellent. There are 10 out of the rest 11 agree with the overall services provided by Rakuzen were excellent and the rest of 1 respondent strongly agree with the overall services provided by Rakuzen were excellent.
5(B) Does the quality of staff excellent?
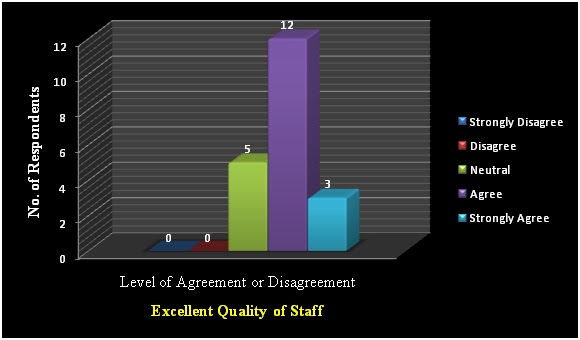
Graph 1.17 Excellent Quality of Staff
The graph in the above shows that 5 out of 20 respondents choose the neutral option about the overall quality of staff provided by Rakuzen were excellent. There are 12 out of the rest 15 agree with the overall quality of staff provided by Rakuzen were excellent and the rest of 3 respondents strongly agree with the overall quality of staff provided by Rakuzen were excellent.
5(C) Is the environment excellent?
Graph 1.18 Excellent Environment
The graph in the above shows that 8 out of 20 respondents choose the neutral option about the overall environment provided by Rakuzen were excellent. There are 9 out of the rest 12 agree with the overall environment provided by Rakuzen were excellent and the rest of 3 respondents strongly agree with the overall environment provided by Rakuzen were excellent.
5(D) Is the quality of food excellent?
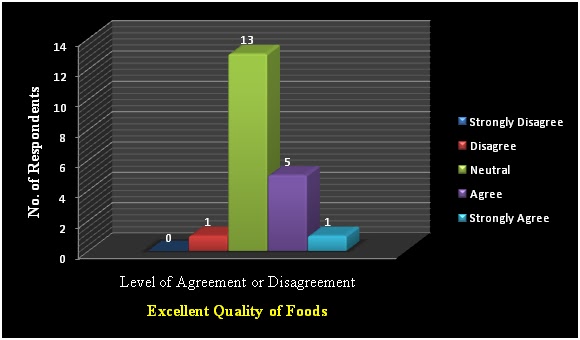
Graph 1.19 Excellent Quality of Foods
The graph in the above shows that 1 out of 20 respondents disagree with the overall quality of foods provided by Rakuzen were excellent.and 13 out of the rest 19 choose the neutral option about the overall quality of foods provided by Rakuzen were excellent. There are 5 out of the rest 6 agree with the overall quality of foods provided by Rakuzen were excellent and the rest of 1 respondent strongly agree with the overall quality of foods provided by Rakuzen were excellent.
5(E)Would you like to recommend Rakuzen to your friends or relatives?
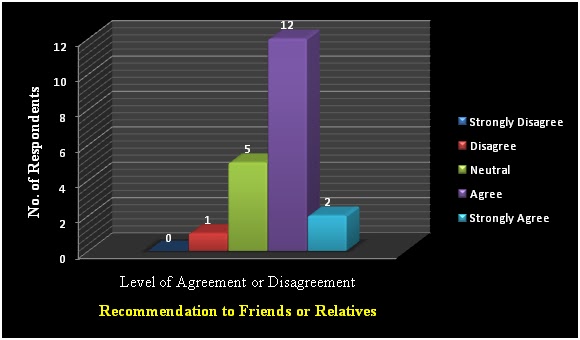
Graph 1.20 Recommendation to Friends or Relatives
The graph in the above shows that 1 out of 20 respondents disagree to recommend the Rakuzen to the friends or relatives and 5 out of the rest 19 respondents choose the neutral option. There are 12 out of the rest 14 agree to recommend the Rakuzen to the friends or relatives and the rest of 2 respondents strongly agree to recommend the Rakuzen to the friends or relatives.
No comments:
Post a Comment