Wednesday 5 December 2012

Conclusion

After analyse all the data that I had collected, the overall result customer satisfaction about Rakuzen will be conducted. As the below, the table shows the mean point for each questions. 

Table 1.1 Mean Point For Each of The Questions 
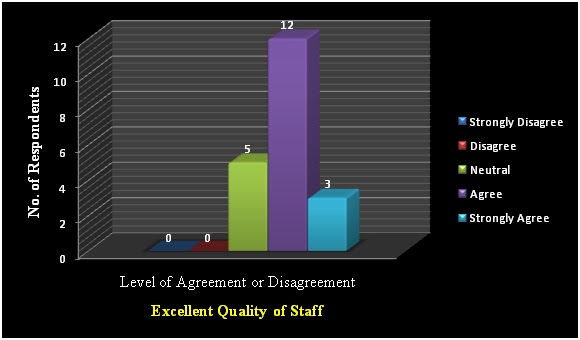
Staff's Services
Table in the above shows that (A) Staff's Attentive and Availability received 3.4 mean points, (B) Staff's Knowledge about Menu Items received 3.6 mean points, (C) Staff's Attitude received 3.45 mean points, (D) Staff's Appearance received 3.7 mean points and (E) Staff's level of Taking Care the Order received 3.25 mean points which it is the lowest among the Staff's Services. 

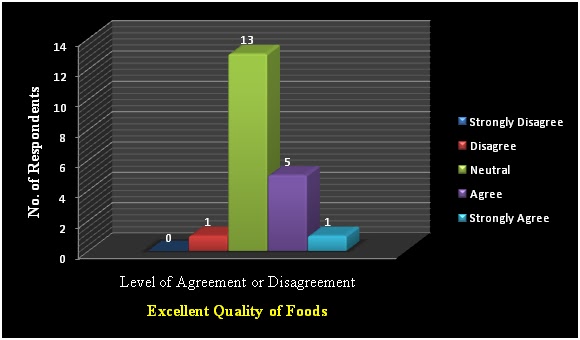
Products (Food Quality)
Table in the above shows that (A) Foods Served Correctly As Order received 3.5 mean points, (B)Foods Served Hot and Fresh received 3.7 mean points, (C) Food Serving Speed received 3.35 mean point which it is the lowest among the Product's Quality, (D) Food Taste, Cleanliness and Flavour received 3.75 mean points which it is the highest among the Products Quality and (E) Selection of Menu Items received 3.6 mean points. 

Environment
Table in the above shows that (A) Restaurant's Cleanliness received 3.5 mean points which it is the lowest among the environment, (B) Tables And Chairs' Cleanliness received 3.65 mean points, (C) Environment Comfortable and Leniency received 3.55 mean points, (D) Restaurant's  Lighting received 3.6 mean points and (E) Restaurant's Environment received 4.1 mean points which it is the highest among the Environment and it is also the highest among these categories.

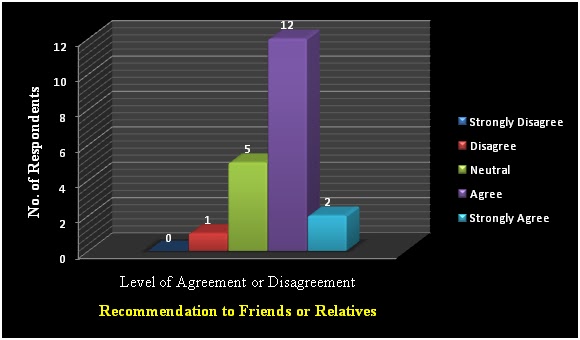
In conclusion, Rakuzen Desa Park City is having a good environment satisfaction as it is score the highest among these categories.Other than improve the environment, they should also be able to work hard in the area of staff's services and food quality in order to get the balanced among these categories. It is only the way to make their business more success.

Observations

After I had collected the information by questionnaire from the customers. I had went to the restaurant and make a request to the manager to take the photo of the restaurant environment in order to get more accurate result to support my questionnaire. The following photos were capture during their break time and even after their operation hours.The photos are arranged according to the questions in the questionnaire. Some of the questions is not able to use the photo to describe, so, it will not be shown at the following.

Staff Services
2(D)Does the staff dress appropriately, neat and cleans in appearance?
The Staffs of Rakuzen were wearing uniforms provided by the Rakuzen. Besides that, they will also provided name tag to their staffs in order to easier the customer to call them when some mistake made by the staff.
Products
3(E)Does the menu had an excellent selection of items?
   
There are three type of menu provides to the customer such as Beverage Menu, Promotion Menu and Main Menu. Beverage Menu conducts of soft drinks and Japanese Beer called Sake. Promotion Menu will be change every season. This is to make customers have more choice. Main Menu conducts of Main Course, Appetizers, Kushiyaki,Yakimono, Agemono and etc.

This is the Main Course of the Menu.
   
This two pictures are their Main Course which it was very popular and easier to order. All of the food in these slides will be served by a tray to the customers.
Environment
4(A)  Is the restaurant very clean?                     
The floor is clean and dry.
     
The floor is clean and dry. The staffs will sweep and mop every day after their operation time. This is to make sure  the customers can enjoy their meal under a comfortable and clean environment.


4(B)Are the tables and chairs very clean?
The chair is very comfortable. The staffs will wipe it every day before and after their operation time.
The table will be wipe every time after the customer finish their meal.
4(C)Is the restaurant’s ventilation excellent?
Rakuzen's ventilation is better then indoor when it at the outdoor.
4(D)Is there excellent lighting?
The lighting in this area is quite good and the environment is comfortable and leniency. There are air-conditioner at the ceiling.  
In this area, the lighting is quite bad. It is very hard to read the menu.
4(E)Does the environment comfortable and leniency?
The seat is very comfortable and it will not hot when sit on it..
The outdoor environment is very good. Customer can enjoy their meal while enjoying the Desa Park City's views.
There is a leniency of environment in this area. It's encouraged customers to have enough space to move.
The chair is very comfortable and the style designed is cushion pattern.


Results or Data of the Questionnaire Collected

After collect all the questionnaire from the customers, I had using the SPSS Software to analyse the data. The following section shows the analysis of the result I get.The followings are the result of graph and table for each of the question in the questionnaire.

Staff's Services

2(A) Does the staff attentive and available when you needed him or her?

 Graph1.1 Staff's Attentive and Availability 

 The graph in the above shows that 15 out of 20 respondents choose the neutral option about the staff's attentive and availability when they needed him or her. Besides that, the graph and table in the above also shows that out of the rest 5 respondents, there are 2 of them agree with the condition of the staff was attentive and available when  they needed him or her and the rest of 3 respondents strongly agree with the condition of the staff was attentive and available when they needed him or her. The reason of 15 out of 20 respondent provided for the neutral side is sometimes the staff was not able to serve them when they are calling the order. They said it might due to the reason of the peak hours, the staff is not able to do so. 

2(B)Does the staff knowledgeable and able to answer your questions about the menu items?
Graph 1.2 Staff's Knowledge about Menu Items (Knowledgeable and Able to Answering Questions)

The graph in the above shows that 1 out of 20 respondents strongly disagree with the staff knowledge about the menu items. Besides that, there are 6 out of the rest 19 respondents choose the neutral options and 12 out of the rest 13 respondents agree with the condition of the staff was knowledgeable about the menu items and able to answers the question asked by customers.Lastly, there are rest of respondents strongly agree with the condition of the staff was knowledgeable about menu items and able to answer the questions asked by them. The reason for 1 out of 20 respondents strongly disagree with the condition of staff was knowledgeable about the menu items and able to answer the question asked is the staff was not sure about what ingredient is include in the foods. For the 6 out of the rest 19 respondents choose the neutral option is because they are facing the same issue with the one who choose strongly disagree option but sometimes the staff can serve very well. 

2(C)Does the staff friendly and patient when taking your order?
                                                     Graph 1.3 Staff Attitude (Friendly and Patient)

The graph in the above shows that 1 out of 20 respondents strongly disagree with the staff's attitude. Besides that, 9 out of the rest 19 respondent choose the neutral option about the staff's attitude and another 9 out of the rest 10 respondents agree with the condition of the staff was friendly and patient when taking their order. There are rest of 1 respondents strongly agree with the condition of the staff was friendly and patient when taking their order. The reason for the 1 out of 20 respondents strongly disagree with the staff's attitude is the staff make the customer feel like the staff don't likely to serve them and act like want to finish the work early. The reason for the 9 out of the rest 19 respondents choose the neutral option is because they feel nothing or they are not able to measure the standard of the staff's attitude.

2(D) Does the staff dress appropriately, neat and cleans in appearance?
                   Graph 1.4 Staff's Appearance (Dress Appropriately, Neat and Cleans)

The graph in the above shows that 1 out of 20 respondents strongly disagree about the staff's appearance and 7 out of the rest 19 respondents choose the neutral option about the staff's appearance. Besides that, there are 8 out of the rest 12 respondents agree with the condition of the staff was wearing appropriately, neat and cleans. There are rest of 4 respondents strongly agree with the condition of the staff was wearing appropriately, neat and cleans. The reason for 1 out of 20 respondents strongly disagree about the staff's appearance is the shirt did not fill in the pants properly. The reason choose neutral option is because majority of them feel nothing about the staff appearance.

2(E) Does the staff has always making sure about the order was served?
                                    Graph 1.5 Staff's Level of Taking Care of Order


The graph in the above shows that each 2 out of 20 respondents strongly agree and disagree about the condition of the staff was always taking care their order. Besides that, there are 6 out of the rest 18 respondents choose neutral side option about the condition of staff's level of taking care the order. There are 9 out of the rest 12 respondents agree with the condition of the staff was always making sure their order was served and the rest of 1 respondents strongly agree with the condition of the staff was always making sure their order was served.The reason for each 2 out of 20 respondents strongly disagree and disagree is because they have not received any action about this services. For the reason of 6 out of the rest 18 respondents choose neutral side is because the food was served correctly and there is not necessary for the staff always come and ask for ensuring the order was out. 

Products

3(A)Does the foods served correctly as order?
      Graph 1.6 Food Served Correctly As Order

The graph in the above shows that 1 out of 20 respondents disagree with the condition of the foods were served correctly as order.There are 11 out of the rest 19 respondents choose neutral option. Besides that, 5 out of the rest 8 respondents agree with the condition of the foods were served correctly as order and the rest 3  respondents strongly agree with the condition of the foods were served correctly.

3(B)Does the food served hot and fresh?
                                                                  Graph 1.7 Foods Served Hot and Fresh

The graph in the above shows that 2 out of 20 respondents disagree with the condition of the foods were served hot and fresh. There are 5 out of the rest 18 respondents choose neutral option. Besides that, 10 out of the rest 13 respondents agree with the condition of the foods were served hot and fresh and the rest 3  respondents strongly agree with the condition of the foods were served hot and fresh. The reason for 5 out of the rest 18 respondents choose neutral option is because of they feel confused about what is the measurement of hot and fresh. It might because the foods have Sushi which is cold to be served or the main course which is hot to be served. They feel confused about it.

3(C)Does the food served very fast? (Minimum 15 minutes)
                                                Graph  1.8 Foods Serving Speed


The graph in the above shows that 2 out of 20 respondents strongly disagree with the condition of the foods were served fast. There are 9 out of the rest 18 respondents choose neutral option. Besides that, 7 out of the rest 9 respondents agree with the condition of the foods were served fast and the rest of 2 respondents strongly agree with the condition of the foods were served fast. The reason for 9 out of the rest 18 respondents choose neutral option is because there are some food served very fast but there are are some food served very slow, they found difficult to decide.

3(D) Are the foods very tasty, clean and flavourful?
                                  Graph 1.9 Food's Taste, Cleanliness and Flavour


The graph in the above shows that 1 out of 20 respondents disagree with the condition of foods were tasty, cleans and flavourful. There are 7 out of 19 respondents choose neutral option. Besides that, 8 out of 12 respondents agree with the condition of the foods were tasty, cleans and flavourful and the rest of  respondents strongly agree with the condition of the foods were tasty, cleans and flavourful. The reason for 7 out of 19 respondents choose neutral option is because some food very delicious but some food might not be very tasty.

3(E) Does the menu had an excellent selection of items?
                                       Graph 1.10 Selection of Menu Items
The graph in the above shows that 2 out of 20 respondents disagree with the condition of the menu items have sufficient selection. There are 6 out of 18 respondents choose the neutral option. Besides that, 10 out of 12 respondents agree with the condition of the menu items have sufficient selection and the rest of 2 respondents strongly agree with the condition of the menu items have sufficient selection. The reason for 6 out of 18 respondents choose the neutral option is because the Rakuzen having change their promotion menu every seasons, when they want to choose the previous seasonal foods, the kitchen cannot managed to do it. It make them feel disappointing


Environment

4(A)Is the restaurant very clean?
                                      Graph 1.11 Restaurant's Cleanliness

The graph in the above shows that 1 out of 20 respondents disagree with the condition of the restaurant was cleans. There are 11 out of the rest 19 respondents choose the neutral option. Besides that, 5 out of the rest 8 respondents agree with the condition of the restaurant was cleans and the rest of 3 respondents strongly agree with the condition of the restaurant was cleans. The reason of 11 out of 19 respondents choose neutral option is because of there are some area very clean but some area is not clean, they cannot managed to decide which option should be tick or choose.


4(B)Are the tables and chairs very clean?
                                  Graph 1.12 Tables and Chairs' Cleanliness

The graph in the above shows that 1 out of 20 respondents disagree with the condition of tables and chairs' were clean. There are 7 out of the rest 19 respondents choose the neutral option. Besides that, 10 out of the rest 12 respondents agree with the condition of tables and chairs' were clean and the rest of 2 respondents strongly agree with the condition of tables and chairs' were clean.

 4(C)Is the restaurant’s ventilation excellent?
                                      Graph 1.13 Restaurant's Ventilation

The graph in the above shows that 1 out of 20 respondents disagree with the condition of the restaurant's ventilation was good. There are 12 out of the rest 19 respondents choose the neutral option. Besides that, 2 out of the rest 7 respondents agree with the condition of the restaurant's ventilation was good and the rest of 5 respondents strongly agree with the condition of the restaurant's ventilation was good.

4(D) Is there excellent lighting?
                                         Graph 1.14 Restaurant's Lighting

The graph in the above shows that 1 out of 20 respondents disagree with the condition of the restaurant's lighting was good. There are 10 out of the rest 19 respondents choose neutral option. Besides that, 5 out of the rest 9 respondents agree with the condition of the restaurant's lighting was good and the rest of 4 respondent strongly agree with the condition of the restaurant's lighting was good. The reason of 10 out of 19 respondents choose neutral option is because of there are some area very bright but some area is dark, they cannot managed to decide which option should be tick or choose.

 4(E). Does the environment comfortable and leniency?
     Graph 1.15 Restaurant's Environment (Comfortable and Leniency)

The graph in the above shows that 4 out of 20 respondents choose the neutral option with the condition of the restaurant's environment was comfortable and leniency. There are 10 out of the rest 16 respondents agree with the condition of the restaurant's environment was comfortable and leniency and the rest of 6 respondents strongly agree with the condition of the restaurant's environment was comfortable and leniency.

Overall Satisfaction

5(A) Does the services excellent?
Graph 1.16 Excellent Services

The graph in the above shows that 9 out of 20 respondents choose the neutral option about the overall services provided by Rakuzen were excellent. There are 10 out of the rest 11 agree with the overall services provided by Rakuzen were excellent and the rest of 1 respondent strongly agree with the overall services provided by Rakuzen were excellent.

5(B) Does the quality of staff excellent?
Graph 1.17 Excellent Quality of Staff

The graph in the above shows that 5 out of 20 respondents choose the neutral option about the overall quality of staff provided by Rakuzen were excellent. There are 12 out of the rest 15 agree with the overall quality of staff provided by Rakuzen were excellent and the rest of 3 respondents strongly agree with the overall quality of staff provided by Rakuzen were excellent.

5(C) Is the environment excellent?
Graph 1.18 Excellent Environment

The graph in the above shows that 8 out of 20 respondents choose the neutral option about the overall environment provided by Rakuzen were excellent. There are 9 out of the rest 12 agree with the overall environment provided by Rakuzen were excellent and the rest of 3 respondents strongly agree with the overall environment provided by Rakuzen were excellent.

5(D) Is the quality of food excellent?
Graph 1.19 Excellent Quality of Foods

The graph in the above shows that 1 out of 20 respondents disagree with the overall quality of foods provided by Rakuzen were excellent.and 13 out of the rest 19 choose the neutral option about the overall quality of foods provided by Rakuzen were excellent. There are 5 out of the rest 6 agree with the overall quality of foods provided by Rakuzen were excellent and the rest of 1 respondent strongly agree with the overall quality of foods provided by Rakuzen were excellent.

5(E)Would you like to recommend Rakuzen to your friends or relatives?
Graph 1.20 Recommendation to Friends or Relatives

The graph in the above shows that 1 out of 20 respondents disagree to recommend the Rakuzen to the friends or relatives and 5 out of the rest 19 respondents choose the neutral option. There are 12 out of the rest 14 agree to recommend the Rakuzen to the friends or relatives and the rest of 2 respondents strongly agree to recommend the Rakuzen to the friends or relatives.


Tuesday 4 December 2012

Questionnaires and Observations


I had stand in front of the Rakuzen restaurant entrance and asked the customer who are leaving the restaurant to fill up the questionnaire. I had asked 20 respondents to completed my questionnaire findings. Their age are around 19-59 year old. I'm very thankful to them that they are willing to lend their hands to fill up the questionnaire.


Questionnaire’s Questions

For the questionnaire section, I have separated it into 3 main parts that are staff services, food qualities and environment and 1 extra part which is overall satisfaction. The respondents were asked to answer the questions by rated the questions according to their level of agreement or disagreement. The outlines of the questions are as follows.

 2. Staff Services
A. Does the staff attentive and available when you needed him or her?
B. Does the staff knowledgeable and able to answer your questions about the menu items?
C. Does the staff friendly and patient when taking your order?
D. Does the staff dress appropriately, neat and cleans in appearance?
E. Does the staff always making sure about your order was served?

3.  Products
A. Does the food served correctly as ordered?
B. Does the food served hot and fresh?
C. Does the food served very fast? (Minimum 15 minutes)
D. Are the foods very tasty, clean and flavourful?
E. Does the menu had an excellent selection of items?

 4. Environment
A. Is the restaurant very clean?
B. Are the tables and chairs very clean?
C. Is the restaurant’s ventilation excellent?
D. Is there excellent lighting?
E. Does the environment comfortable and leniency?

A. Does the service excellent?
B. Does the quality of staff excellent?
C. Is the environment excellent?
D. Is the quality of food excellent?
E. Would you like to recommend Rakuzen to your friends or relatives?

Observations

In order to get more accurate result from the questionnaire collected, I had went to the Rakuzen and make a  request to the manager in order to allow me to take the picture of the environment of the restaurant. I learned that the manager was very friendly and he was provide a condition to me that I'm only allowed to take the picture during their break time or after their operation hours. Therefore, I have chosen to take the picture during their break time and after their working hours.

The data or result of the information collected from the questionnaire and observations will be updated in the next post.

Friday 30 November 2012

Hello...Welcome to my Business Research Blog


Hello everyone, welcome to my blog. I am doing a business research on customer's satisfaction about the Rakuzen Restaurant. Rakuzen is a restaurant that provides the Japanese food to its customers. Rakuzen is an exclusive high end Japanese place that the Japanese expatriates rave about. It has been in operation since 2005. And it has around 7 outlets including itself in whole Malaysia such as Rakuzen Subang Jaya, Rakuzen Hartamas Shopping Center, Rakuzen at Gtower Chulan Square, RakuzenDesa Park City, Rakuzen Empire Shopping Gallery, Rakuzen Publika and Rakuzen Tropicana City Mall. Besides that, Rakuzen has also been taken over by Super Dining Sdn Bhd, the company who owns all the Sushi Zanmai, Sushi Zen, Kura @ One World Hotel, Zen @ Sunway Pyramid and Pasta Zanmai outlets in whole Malaysia.

There are some picture of certain outlets: 
   Rakuzen Subang Jaya


Rakuzen at Gtower Chulan Square


Rakuzen Tropicana City Mall
Rakuzen Empire Shopping Gallery

There are some extra picture: 

    Sushi Zanmai at Fahrenheit 88
     Sushi Zen at Mid Valley


Pasta Zanmai at Empire Shopping Gallery


The purpose of this research is to identify the customer's views about the qualities of Rakuzen such as staff qualities, food qualities and environment qualities.

I will be using 2 methods to do this research which they are observation and questionnaire. I will be choosing the Rakuzen at Desa Park City which located in Menjalara, Kuala Lumpur. The reason I chosen Rakuzen as my business research's target is because it's near to my house. It only takes me around 10 minutes to reach there.

Rakuzen Desa Park City